Microsoft Power BI earns a top expert grade for its powerful data visualization capabilities and seamless integration with the Microsoft ecosystem.
Introduction
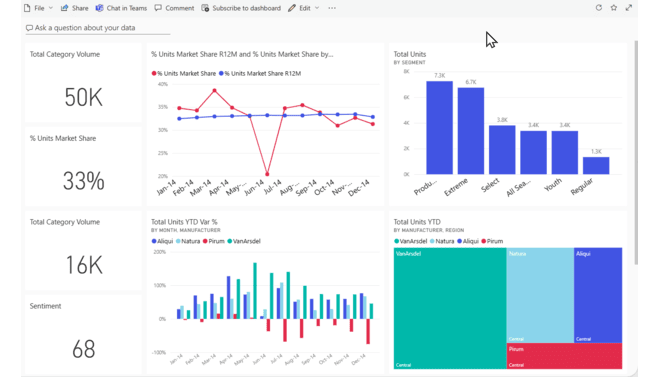
Microsoft Power BI is an interactive business intelligence platform that transforms data from various sources like databases and cloud services into dynamic visualizations that enhance decision-making. As part of the Microsoft Power Platform, it offers a suite of services and connectors, allowing users, from analysts to data professionals, to connect, model, and share data efficiently.
With its user-friendly interface and powerful data modeling features, Power BI makes data analysis accessible to everyone, enabling the creation of insightful reports and dashboards that help organizations make smarter, data-driven decisions in real-time.
Integrated
AI-Powered
Visual
Scalable
Collaborative
Review
Microsoft Power BI earns a top expert grade for its powerful data visualization capabilities and seamless integration with the Microsoft ecosystem. Its primary strength lies in its ability to centralize data and streamline reporting, making it a reliable tool for both simple and complex enterprise-level analytics.
While it can be a bit slow with very large datasets and may have a learning curve for some advanced features, its cost-effectiveness, especially for companies already using Microsoft products, and its continuous evolution with features like Microsoft Fabric, make it an exceptional value for businesses of all sizes
Features
AI-Powered Visuals
Features like Key Influencers and Decomposition Tree use AI to uncover the factors driving a specific metric or to perform root-cause analysis
Natural Language Query (NLQ)
The Q&A feature allows users to ask questions about their data in plain language, and Power BI will instantly generate the correct visualization and answers
Automated Report Creation
The platform can automatically generate a complete report from a dataset, eliminating the need for manual design.
Power Query
A powerful data transformation and cleaning tool that allows users to easily prepare data from over 100 different sources without writing code
DAX (Data Analysis Expressions)
A formula language used for creating custom calculations and measures to get deeper insights from data.
Automated Machine Learning (AutoML)
A feature that simplifies the process of building and deploying predictive models, like sales forecasting or customer churn prediction
Best Suited for
Business Users
Perfect for those who need to quickly create and interact with reports and dashboards to track KPIs and make decisions
Data Analysts
Ideal for connecting to various data sources, cleaning data with Power Query, and building complex data models with DAX
Large Enterprises
The Premium and Fabric offerings are designed to handle large datasets and provide enterprise-grade security and governance
Developers
Power BI Embedded allows for the integration of analytics directly into custom applications
Anyone in the Microsoft Ecosystem
The deep integration with Microsoft 365 makes it a natural and easy choice for companies already using those products
Data-Driven Teams
The platform is for any team that wants to centralize their data, streamline reporting, and move from manual data analysis to automated insights.
Strengths
The drag-and-drop interface and various templates make it easy for users with little to no technical experience.
Power BI is often considered more affordable than competitors like Tableau, especially for businesses with an existing Microsoft license.
The combination of powerful data modeling (DAX) and data transformation (Power Query) tools gives users a comprehensive solution for end-to-end analyticsHi-resolution – great for printing.
From the free version for personal use to the enterprise-grade Premium and Fabric offerings, Power BI can scale to meet the needs of any business size.
Weakness
Some users have reported performance issues and slow loading times when working with extremely large or complex datasets.
While the basics are simple, mastering advanced features like DAX and M-language can have a steep learning curve for new users.
Getting started with: step by step guide
The process for using Microsoft Power BI is straightforward and follows a clear workflow.
Step 1: Get Started
Download Power BI Desktop for data modeling and report creation or use the Power BI service in your browser for sharing and collaboration.
Step 2: Connect and Transform Data
Connect to your data sources and use Power Query to clean, shape, and combine the data.
Step 3: Refine Your Images
Use the intuitive drag-and-drop interface to create interactive visualizations and a compelling data story.
Step 4: Publish and Share
Publish your report to the Power BI service to share with your team and collaborate in real-time.
Step 5: Explore and Analyze
Use features like Q&A to ask questions in plain language and uncover deeper insights from your data.
Frequently Asked Questions
Q: Can Power BI connect to non-Microsoft data sources?
A: Yes, the Power BI Desktop application is free to download and use for creating reports, but you need a Pro license to publish and share them with others.
Q: Q: What is the main benefit of using Power BI?
A: Power BI offers robust security features, including row-level security and sensitivity labels, to ensure data is secure and users only see the information they’re supposed to.
Q:Q: Is Power BI Desktop free?
A: The main benefit is its ability to transform complex data into actionable, visual insights quickly and affordably, especially for companies already in the Microsoft ecosystem.
Pricing
Microsoft Power BI offers several pricing options, including a free version, per-user licenses, and capacity-based models for larger enterprises.
Basic
$14/month
Limited image generation and access to community channels.
Standard
$24/month
Includes all Pro features plus advanced AI and analytics, and support for larger datasets.
Pro
Variable
Capacity-based pricing for developers who want to embed analytics in their own applications.
Alternatives
Qlik Sense
An analytics platform that uses an associative data model to allow users to explore data freely without traditional query-based limitations
Looker
A data platform that uses LookML to create a data model, making it a great option for organizations using SQL-based databases like Google BigQuery
Zoho Analytics
An affordable and user-friendly tool for small businesses, with an AI-powered assistant (Zia) and a simple pricing structure.
Share it on social media:

Microsoft Power BI
Sale Has Ended