")


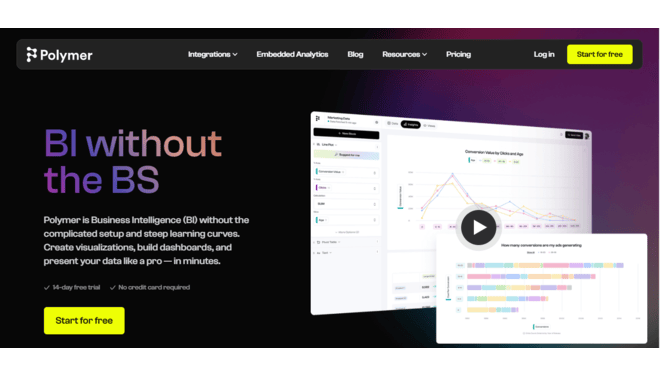
Polymer is an advanced AI-driven data analysis and visualization software that allows users to create customizable dashboards and presentations easily.
Introduction
Polymer is an advanced AI-driven data analysis and visualization software that allows users to create customizable dashboards and presentations easily. It is particularly beneficial for businesses aiming to integrate powerful analytics into their applications or websites without extensive coding.
Leveraging conversational AI and sophisticated data algorithms, Polymer simplifies data exploration, making it accessible for users with varying technical skills. This enables individuals to uncover insights and produce professional reports effortlessly. Additionally, Polymer enhances collaboration by allowing team members to share and present data findings efficiently, promoting informed decision-making. Overall, Polymer is a versatile tool that empowers organizations to harness their data effectively.
AI-Generated
Embedded
No-Code
Visual
Scalable
Review
Polymer AI earns a strong expert grade for its innovative use of AI to democratize data analysis. Its primary strength lies in its AI-generated dashboards and conversational AI interface, which simplify the process of gaining insights from data. This makes it a great choice for non-technical users and small teams who need a quick and easy way to visualise their data.
However, the tool faces some limitations, including a need for more robust data connectors, a lack of real-time syncing on some plans, and higher costs for more advanced features. Overall, Polymer is a great solution for teams that need fast, no-code data analysis, but may not be the best fit for large enterprises with complex, real-time data needs.
Features
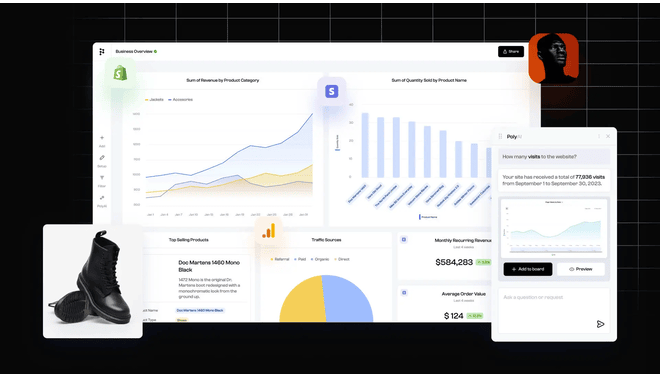
AI-Generated Dashboards
Polymer uses AI to automatically create insightful dashboards as soon as you connect your data, providing instant insights
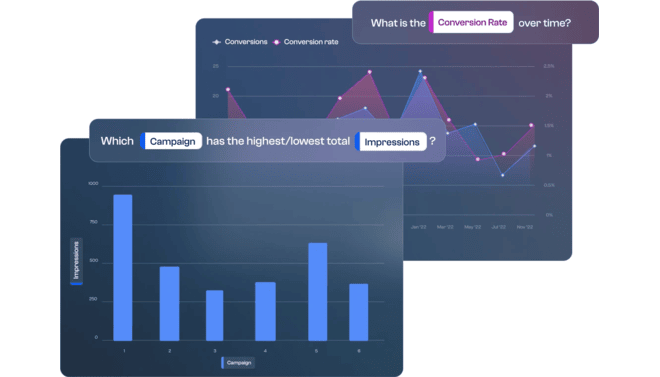
Conversational AI Interactions
PolyAI feature allows you to interact with your data using a conversational chatbot, simplifying complex queries and making data exploration more intuitive
Data Connectors
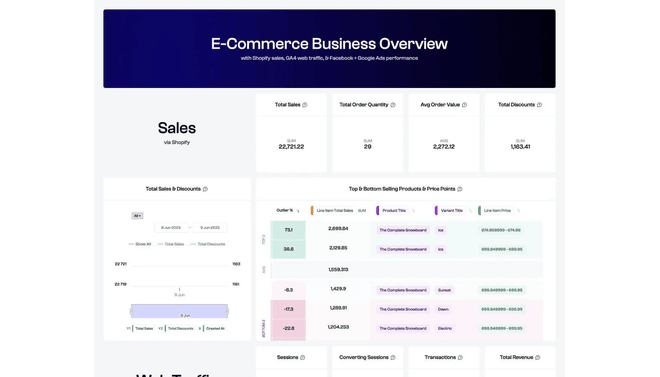
The platform connects to various data sources, including Google Sheets, Google Ads, Facebook Ads, Shopify, and more, consolidating all your data in one place
No-Code Dashboard Designer
The drag-and-drop interface lets you build and customize interactive dashboards without writing a single line of code
Embedded Analytics
Embedded Analytics: Polymer is designed to allow developers to easily embed charts, graphs, and entire dashboards into their web applications
Data Management
The platform includes tools to help you clean, shape, and standardise your data before analysis, ensuring data quality
Best Suited for
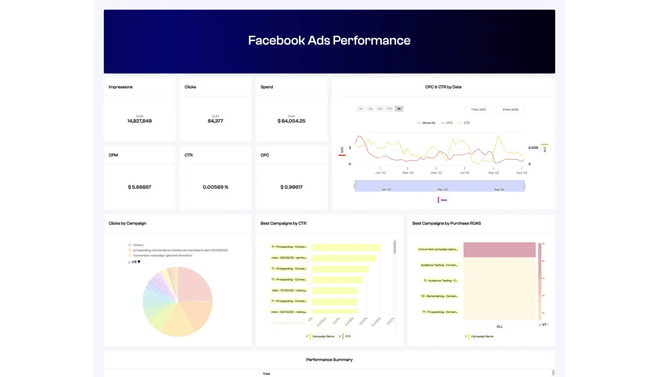
E-commerce & Marketers
Ideal for creating dashboards to monitor campaign performance and track KPIs from platforms like Google Ads and Facebook Ads
Business Teams
Perfect for small teams or individuals who need a user-friendly tool to quickly visualize and analyze data without a technical background
Developers
Excellent for those who need to embed analytics into their applications with a few lines of code
Writers & Editors
The tool helps with summarizing data and creating reports, freeing up time for other tasks.
Content Creators
A great solution for creators looking to track engagement metrics and audience insights, helping them refine their content strategies
Sales Teams
Useful for sales professionals to analyze customer data and sales trends, enabling more informed decisions and strategies to boost performance
Strengths
Polymer’s intuitive interface and no-code approach make it highly accessible to users.
The AI-generated suggestions and conversational interface are unique features.
The ability to embed analytics directly into applications is a key advantage for developers for building data-driven products.
The tool’s wide range of features and data connectors make it useful for various industries
Weakness
Real-time data syncing is only available on the most expensive plans.
Some standard data connectors, like Shopify, come with a separate fee, adding to the overall cost of the platform.
Getting started with: step by step guide
Using Polymer AI is designed to be a simple, step-by-step process that allows you to start analyzing your data quickly.
Step 1: Connect Your Data
Start by connecting your data source to Polymer. You can upload a CSV or connect to platforms like Google Sheets, Google Ads, or Shopify.
Step 2:Generate a Dashboard
Once connected, Polymer’s AI will automatically generate a dashboard with suggested insights.
Step 3: Use the AI
Use the conversational AI to ask questions about your data in natural language or use the drag-and-drop interface to build custom visualizations.
Step 4: Edit and Share
You can then edit the AI’s output, customize the design of your dashboard, and share it with your team.
Step 5: Monitor
Use the dashboard to monitor key metrics and uncover new insights to drive business decisions.
Frequently Asked Questions
Q: Does Polymer support real-time data syncing?
A: Real-time data syncing is only available on the enterprise plan, with hourly syncing available on the pro plan and manual syncing on the free and starter plans
Q: Is Polymer a standalone tool?
A: Polymer is a standalone data visualization tool, but its strength lies in its ability to embed analytics into other applications and websites.
Q: Can Polymer connect to all my data sources?
A: Polymer supports a wide range of data connectors, but some users have noted that it is missing connections to popular services like Salesforce and HubSpot.
Pricing
Polymer offers a tiered pricing structure based on features, data synchronization frequency, and custom options. The pricing can be complex, with separate costs for some data connectors.
Basic
$25/month
Manual data syncing and 1 custom template.
Standard
$50/month
Hourly data syncing and 5 custom templates.
Pro
$125/month
Includes unlimited custom templates and hourly data syncing.
Alternatives
Metabase
An open-source business intelligence tool that is a popular alternative for businesses that prefer self-hosted solutions
Domo
A cloud-based, end-to-end business intelligence platform that provides strong data governance and a unified platform for all your data needs
Looker Studio
A free data visualization tool that connects seamlessly to Google products and offers a wide range of templates for building dashboards
Share it on social media:
Questions and answers of the customers
There are no questions yet. Be the first to ask a question about this product.

Polymer AI
Sale Has Ended